The following is an analysis of data for the period of January to March 2020 compared to the period of January to March 2019.
- Ship calls
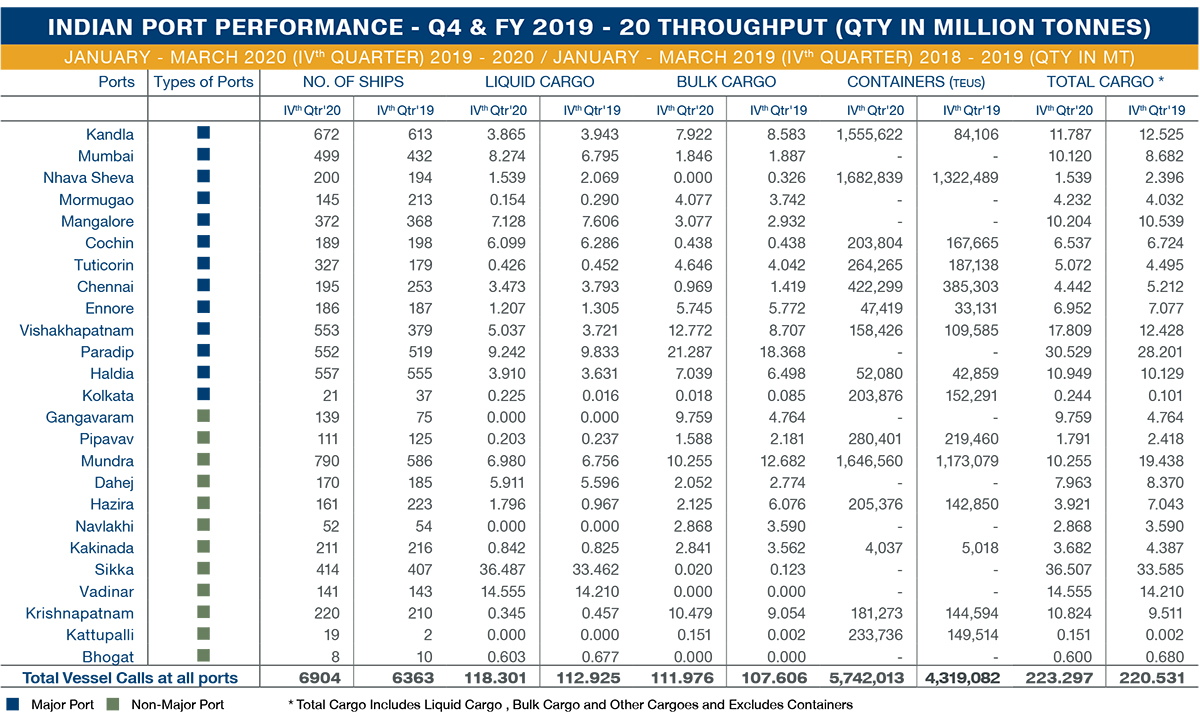
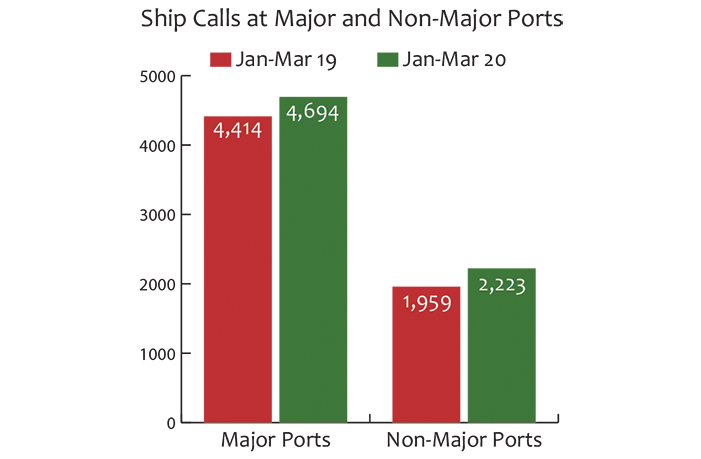
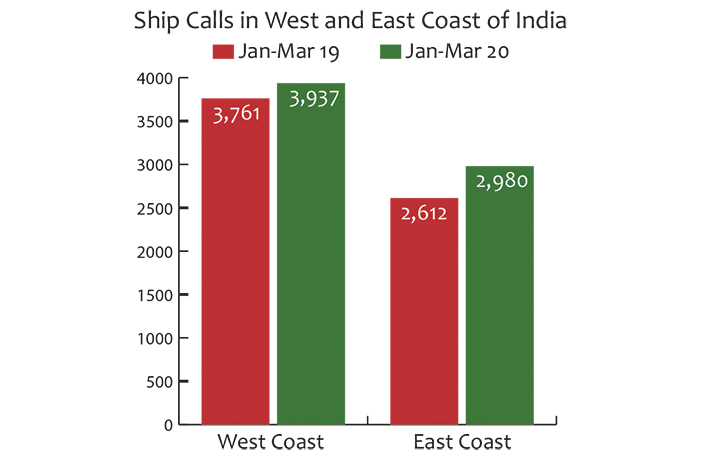
During the period of Jan-Mar 2020, a total of 6,917 ships called on Indian ports, an increase of 10% over the same period last year (corresponding increase in total cargo volume is 1.4%). 68% of the ships called on Major Ports with the balance 32% calling on NonMajor Ports. Major and Non-Major Ports saw an increase of 6% and 13% respectively. The west coast saw a 5% increase and the east coast saw a 14% increase in ship calls.
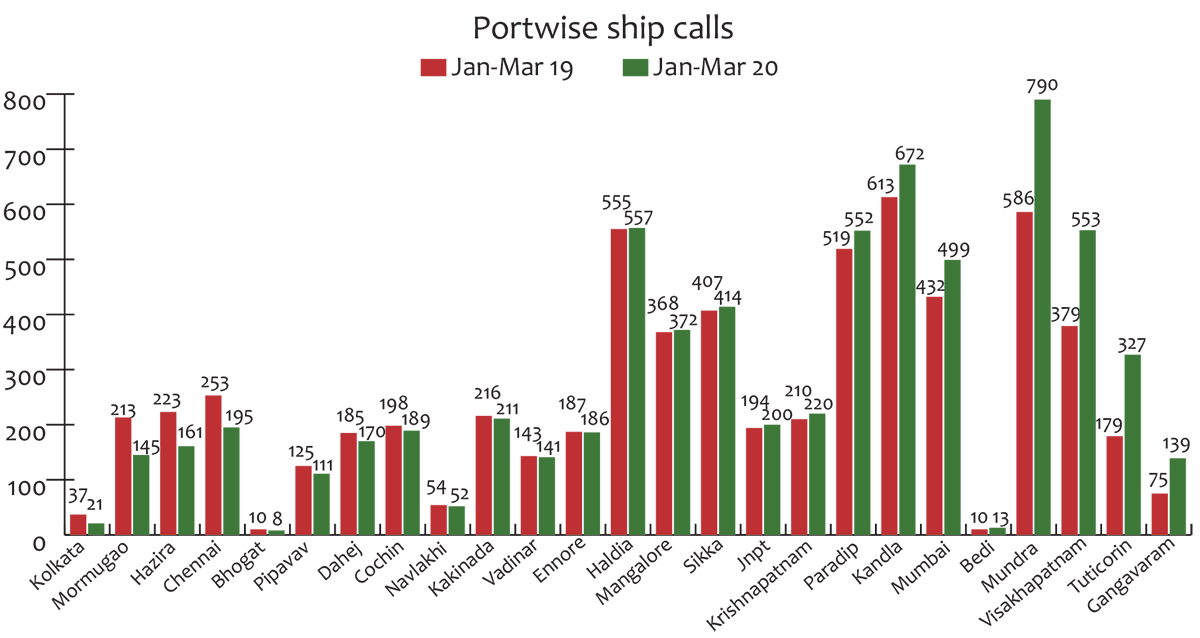
Kolkata Port saw the most decline in ship calls at (-43%) followed by Mormugao (-32%), Hazira (-28%) and Chennai (-23%). Gangavaram Port saw the highest increase in ship calls at 85% followed by Tuticorin 83%, Visakhapatnam 46% and Mundra 35% during the period of Jan-Mar 2020 when compared to the same period last year.
- Liquid, Bulk and Container Cargo Trends
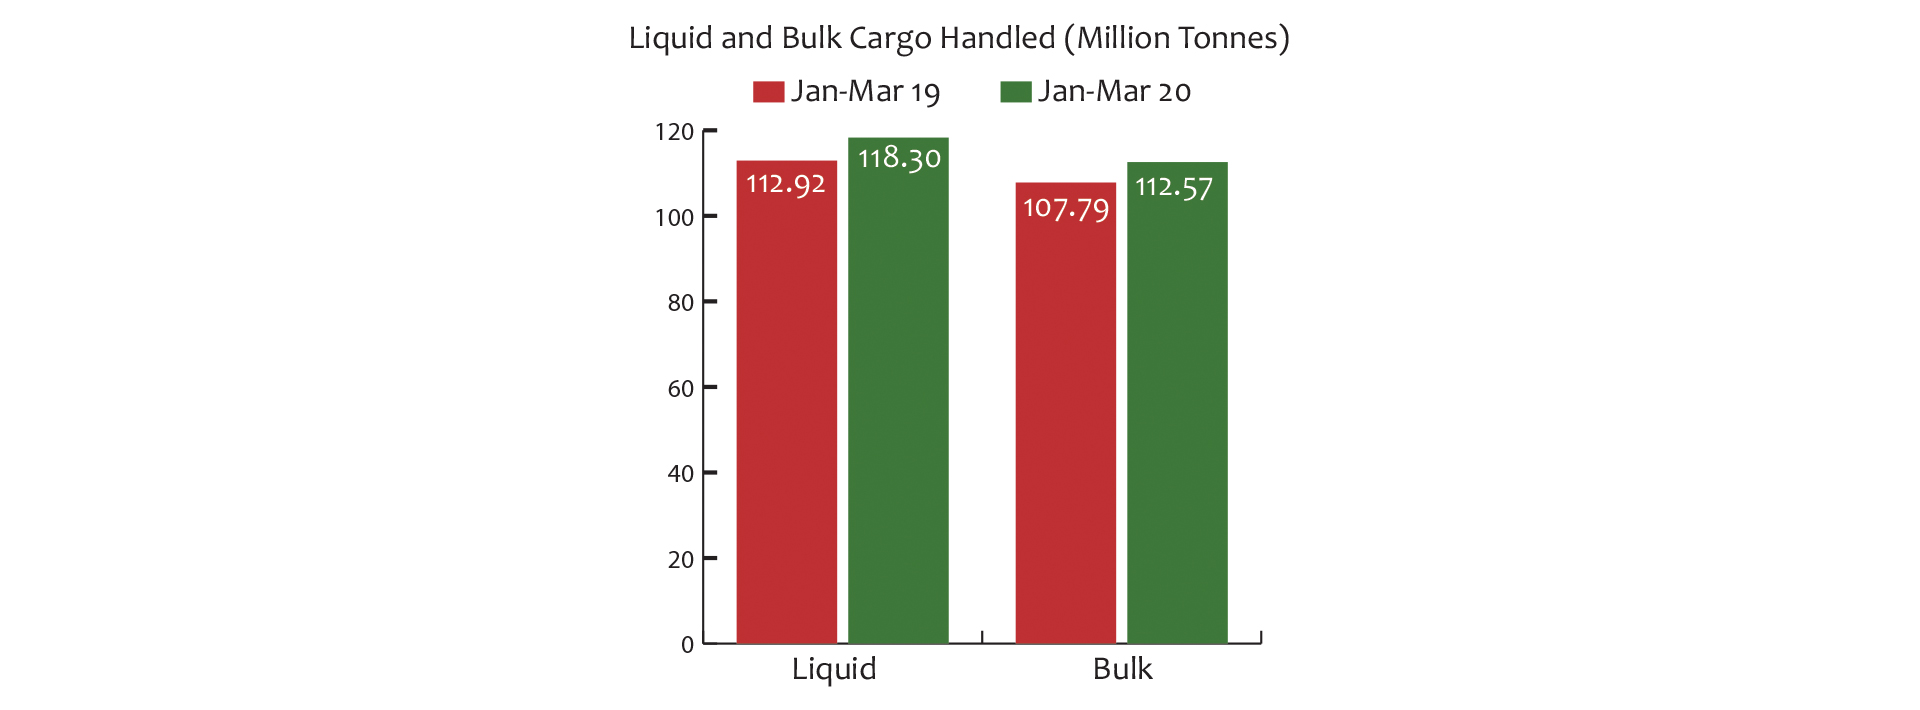
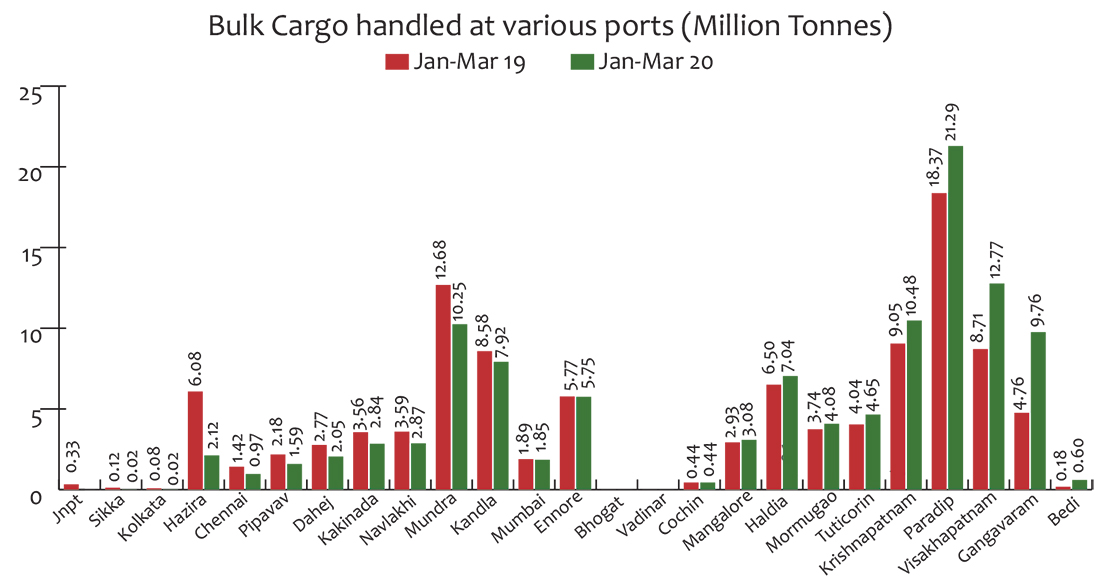
A total of 231 million tonnes (liquid and bulk cargo excluding containers) handled during the period of Jan-Mar 2020, a 4.6% increase from the same period last year. 118 million tonnes of liquid cargo and 113 million tonnes of bulk cargo was handled, an increase of 4.8% and 4.4% respectively when compared with same period last year.
The port data considered for analysis is for the period of Jan-Mar 2020 and compared with data for the same period last year. The analysis, hence, considers pre-COVID-19 period and aligned with previous port traffic trends.
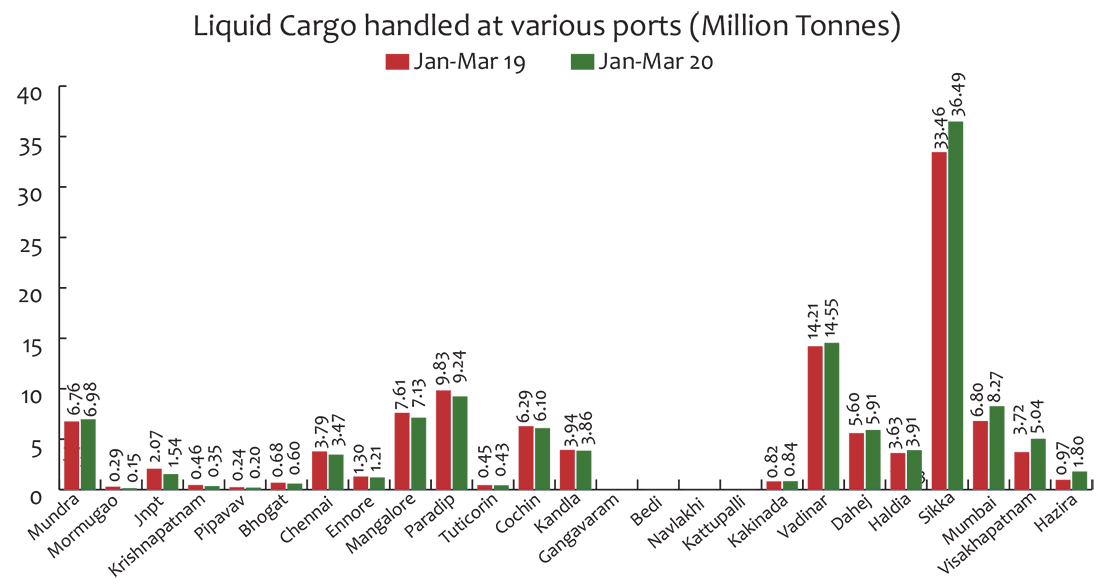
Visakhapatnam 35% saw the most increase in liquid cargo handled followed by Mumbai 22% and Sikka 9%. Chennai (-8%), Mangalore (-6%) and Kandla (-2%) saw moderate dip in cargo volumes handled.
In the bulk cargo segment, Hazira saw a decline of (-65%) in volumes handled and Kakinada, Navlakhi and Mundra experiencing a (-20%) decline. Gangavaram 105%, Visakhapatnam 47% and Paradip 16% recorded a steep increase in bulk cargo handled during the period.
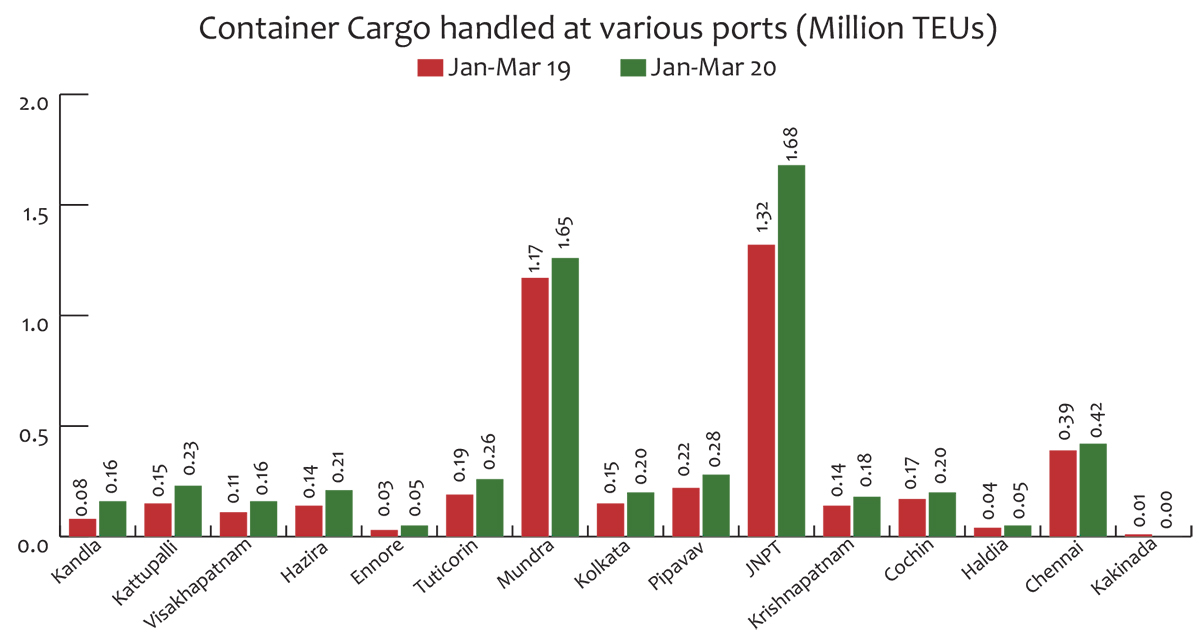
A total of 5.74 million TEUs were handled in Jan-Mar 2020, a 33% increase over the same period last year. Kandla saw the most increase in container cargo handled at 85% with other ports also recording significant increase in cargo volumes. JNPT (1.68 million TEUs) and Mundra (1.65 million TEUs) continued to handle most of the country’s container volumes with 27% and 40% increase in cargo volumes, respectively.

Key Cargo Performance
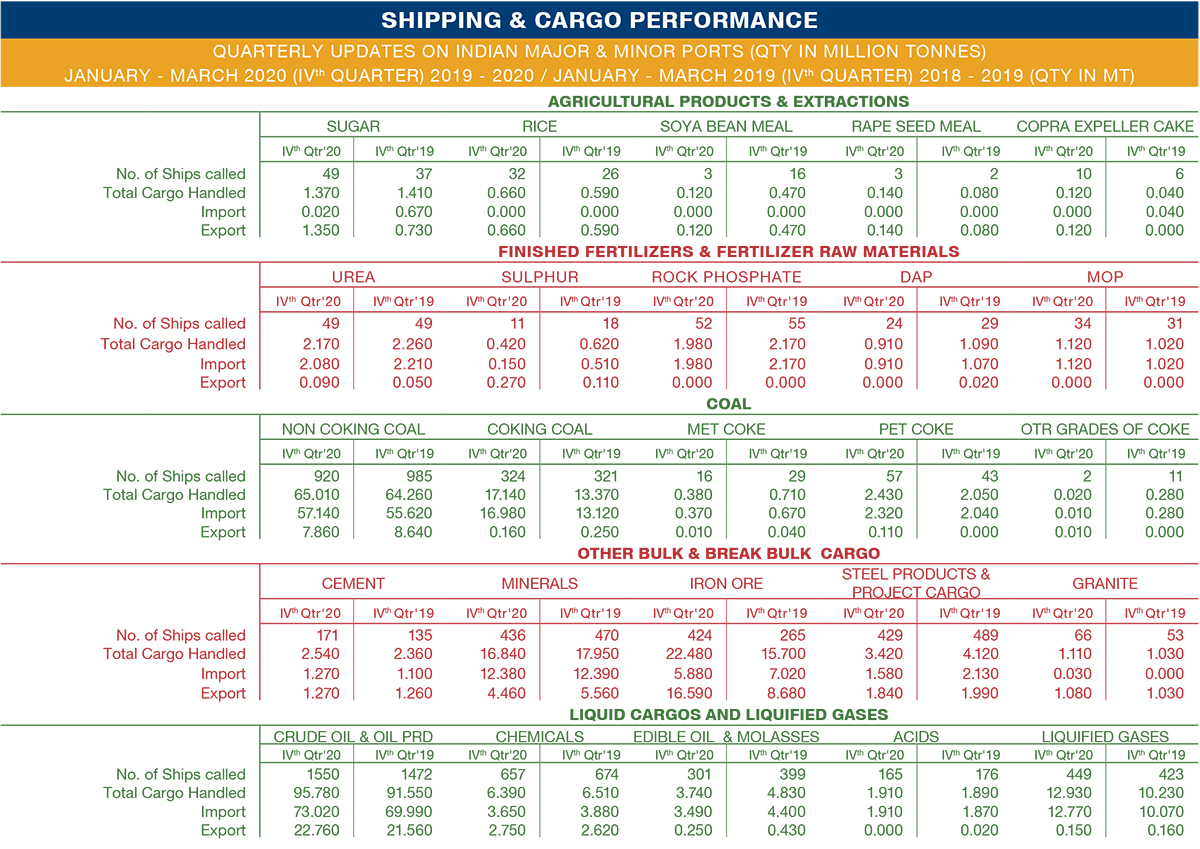
- Coal and Coke
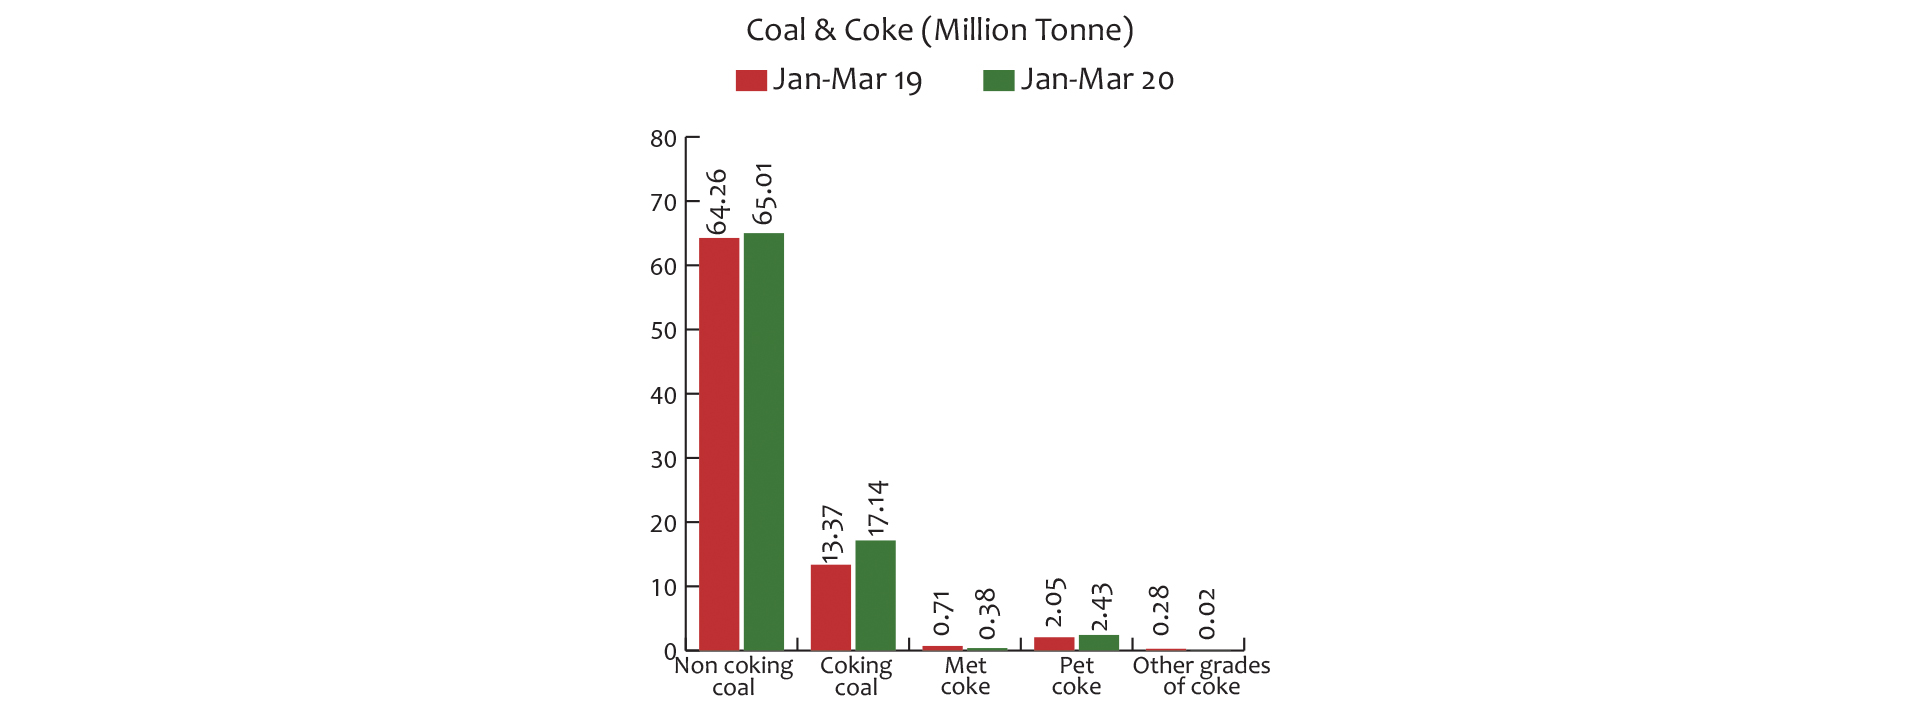
A total of 85 million tonnes of coal and coke was handled in Jan-Mar 2020 (including coastal volumes). Non-coking coal 77% and coking coal 20% constituted the primary products handled. Met coke saw the most decline at (-47%) while coking coal 28% and pet coke 19% saw an increase in volume handled during the period of Jan-Mar 2020 compared to the same period last year. Non-coking coal volumes remained the same.
- Other bulk and breakbulk
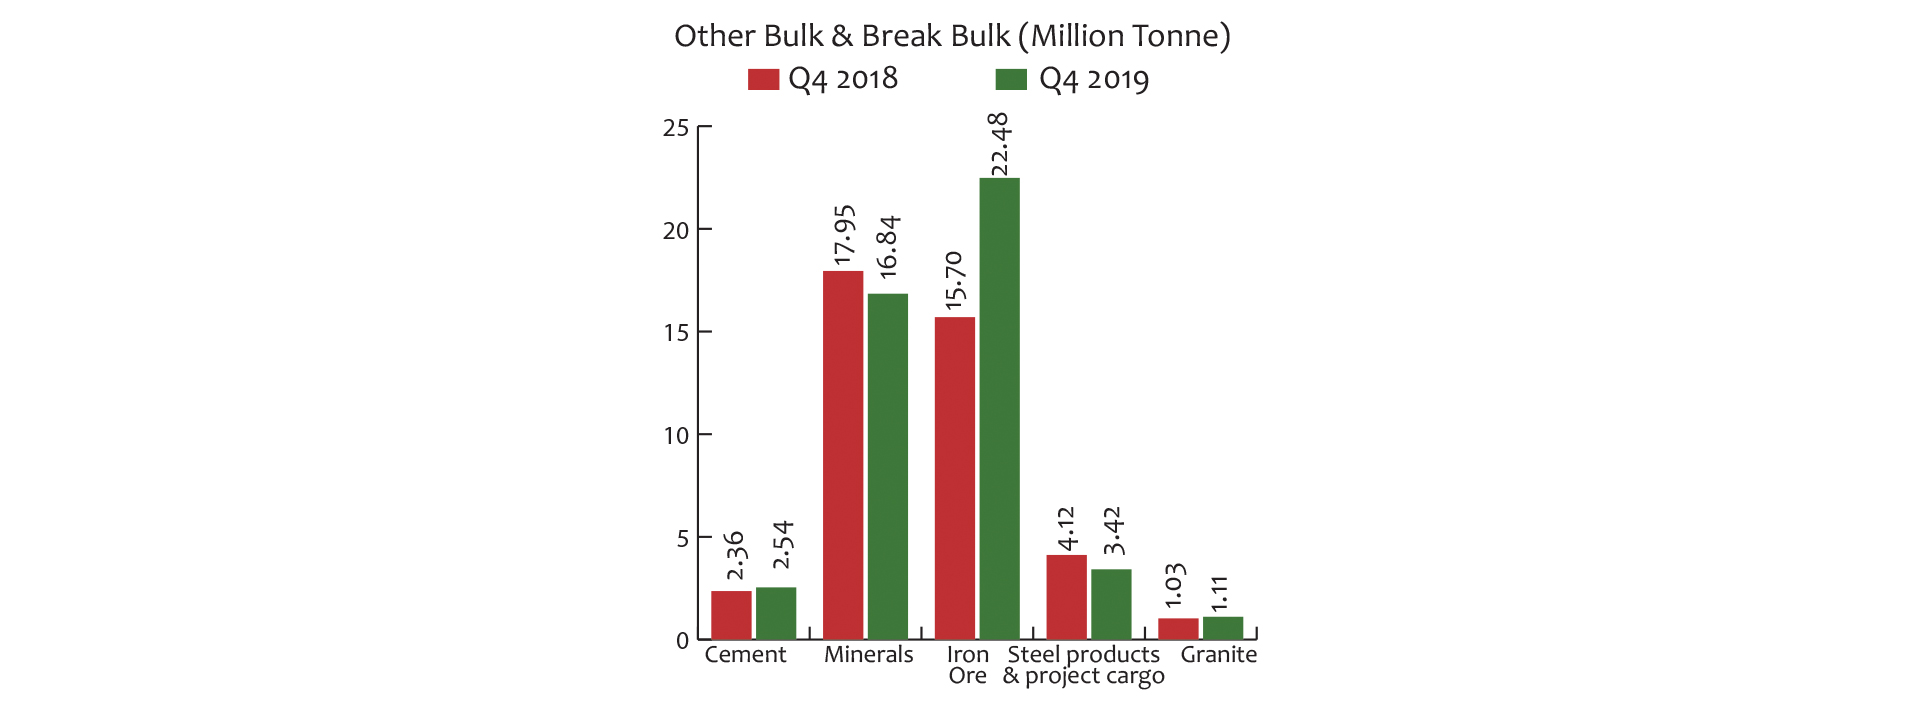
Iron ore handling saw an increase of 43%, while steel and project cargo saw a decline of (-17%) in Jan-Mar 2020 compared to the same period last year. Cement and granite saw an increase of 8%.
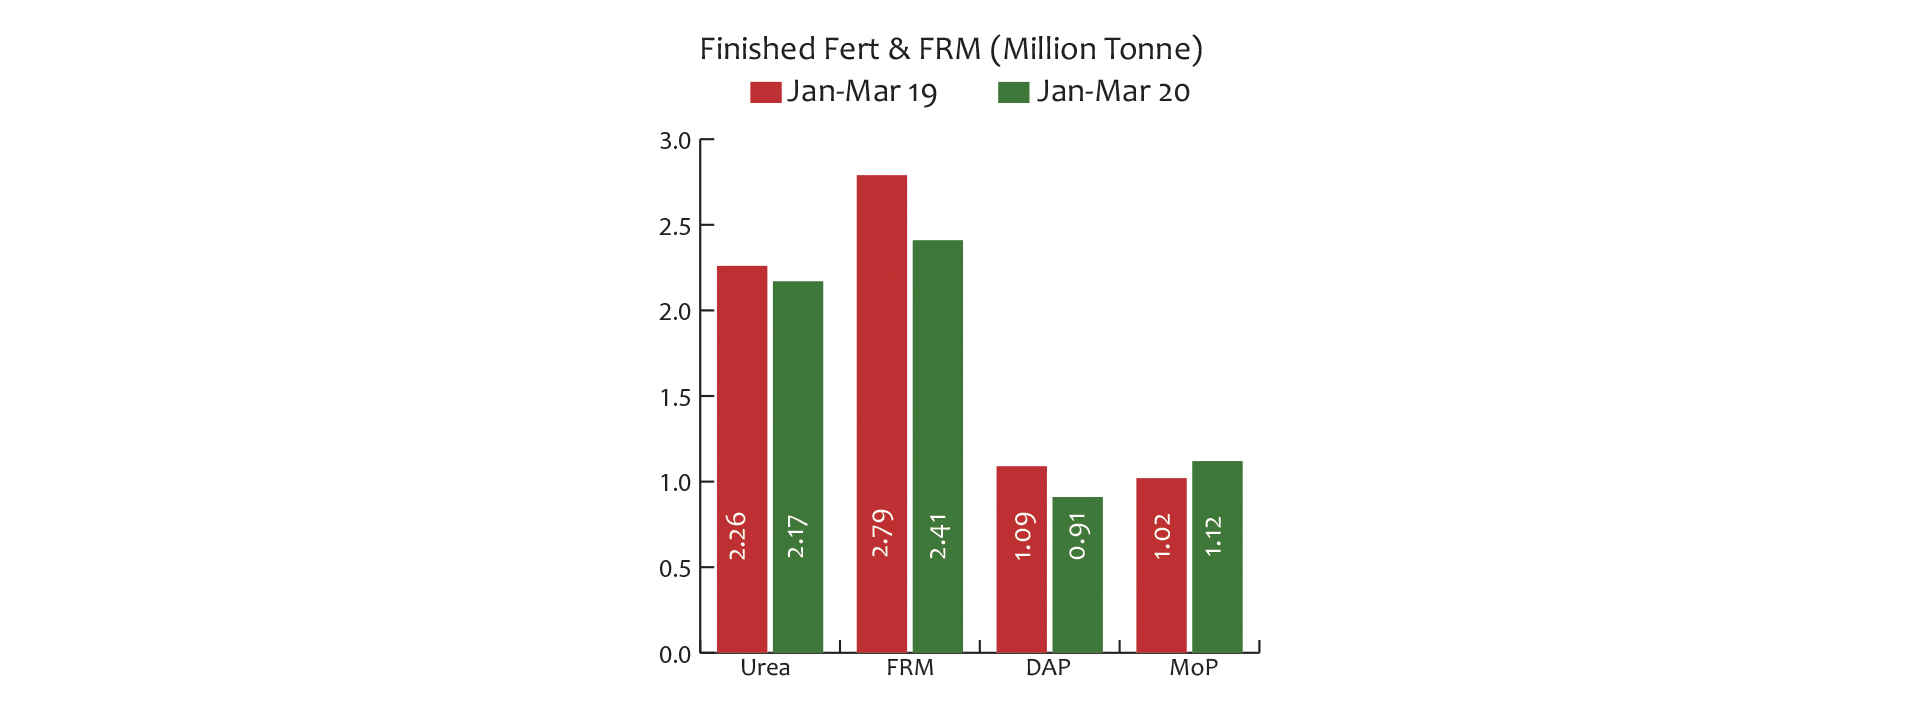
- Finished fertilizers and FRM
A total of 6.6 million tonnes of fertilizers and FRM was handled in Jan-Mar 2020, a decrease of (-8%) compared to the same period last year.
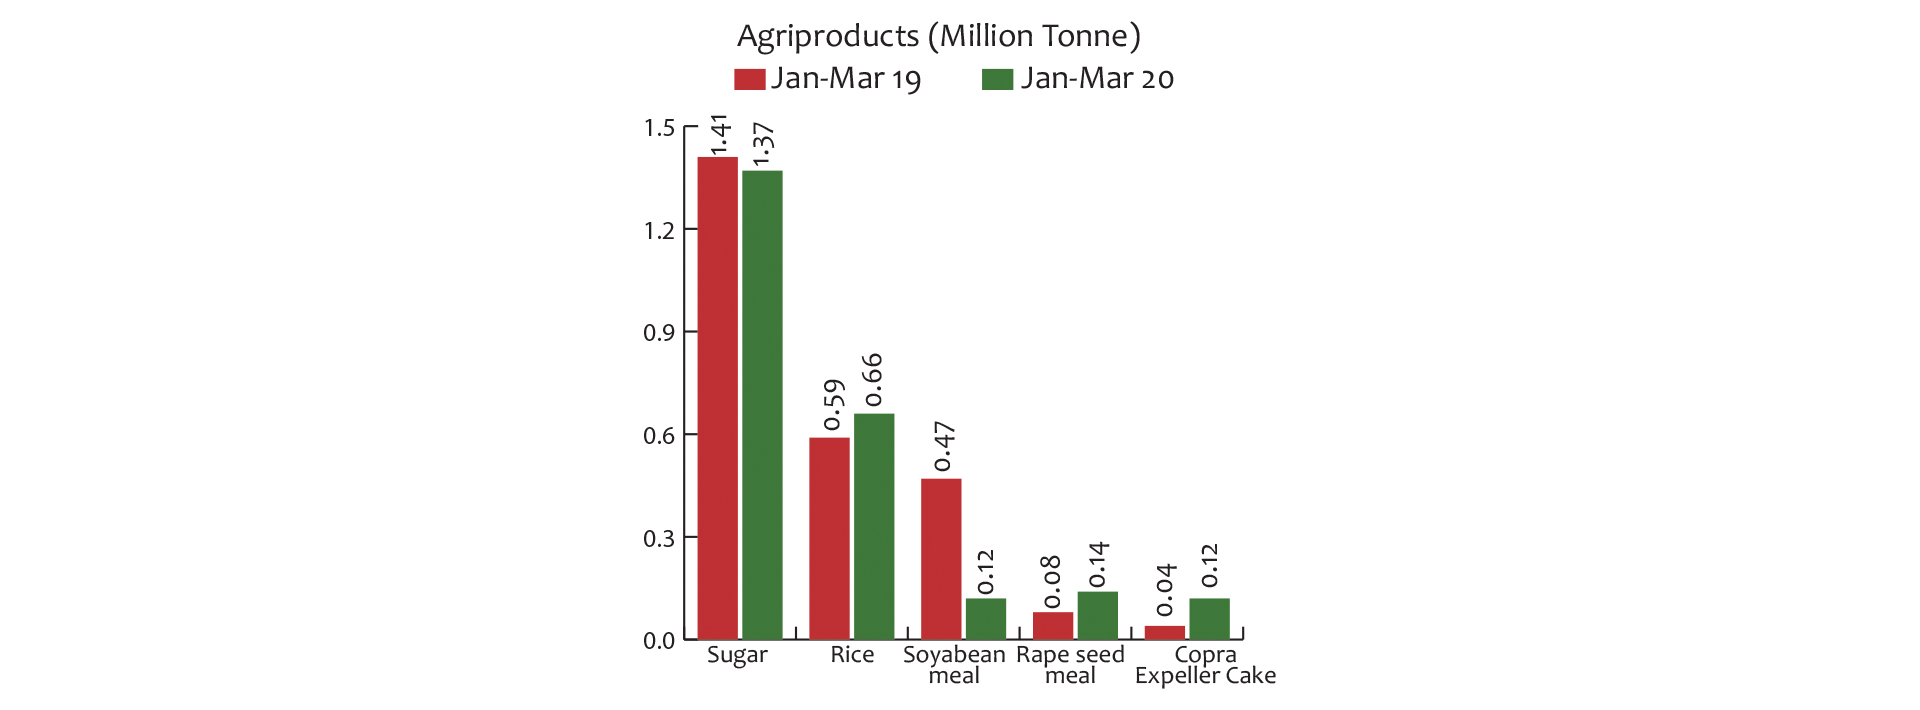
- Agriproducts
Volume of agriproducts decreased by (-7%) at 2.4 million tonnes handled during Jan-Mar 2020.
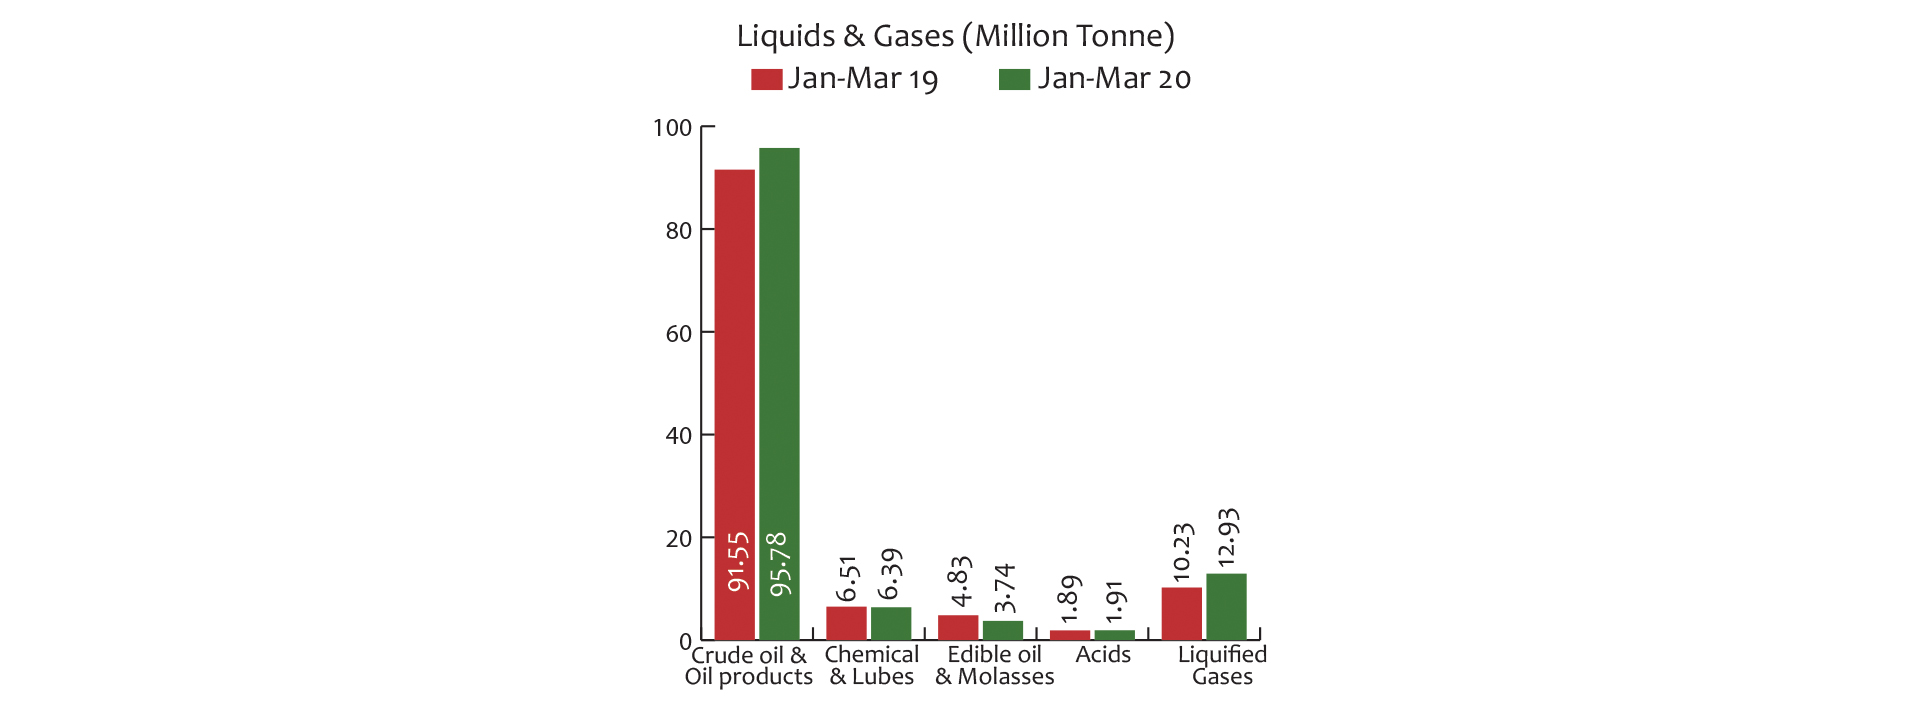
- Liquids and gases
Volume of liquids and gases increased by 5% with total volumes handled at 121 million tonnes. Liquified gases saw an increase of 26% while edible oil and molasses saw a decline of (-23%).